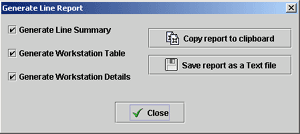
The Generate Report Dialog


Line Report Dialog


    This window gives you the opportunity to export final line information in a format easily editable in a spreadsheet software like Excel.

    Use the checkboxes to specify what kind of data you need to export.

  • Line Summary Option : This option will add to the report a summary of the line in the following format :

Project Name VariantsProjectFinished.csv
Path C:\Program Files\VariantsProjectFinished.csv
Operations
22
Unassigned
0
Workstations
5
Total Cycle Time
7500
Total Operation Time
5217
Total Operator Time
5217
Disbalance (average)
25.04
percents
Disbalance (operators)
25.04
percents

    • Project Name : The name of the project
    • Path : The location where the project is saved
    • Operations : The total number of operations in the line
    • Unassigned : The number of operations that are not assigned to a workstation
    • Workstations : The total number of workstations in the line
    • Total Cycle Time : This value is the sum of all the workstation cycle times
    • Total Operation Time : This value is the sum of the durations of all operations in the assembly line. In case of variants, the durations are weighted averages over all variants
    • Total Operator Time : This value is the sum of the durations of all operations in the assembly line taking into account the schedule of the operators within each workstation. If you have a single operator per workstation, this value is equal to the "Total Operator Time" value
    • Disbalance (average) : This value shows the average disbalance of the line. It is the sum over all workstations, of absolute values of differences between the ideal cycle time of a workstation and the sum of operation durations on that workstation, divided by the Total Operation Time. The ideal cycle time of a workstation is the "Total Operation Time" divided by the "Total Cycle Time" (as computed above) multiplied by the workstation cycle time.
      If the line is perfectly balanced, the Disbalance is 0%. The value grows as the solution departs from a perfectly balanced one, e.g. with one workstation containing all the operations and a second workstation empty, the disbalance is 100%.
    • Disbalance (operators) : This value is the same as average Disbalance, but takes into account the schedule of the operators within each workstation.

  • Generate Workstation Table : This option will generate a table summarizing all the workstations in the following format :

 
Workstation 1
Workstation 2
Workstation 3
Workstation 4
Workstation 5
Position
1
2
3
4
5
Cycle Time
1500
1500
1500
1500
1500
Max Peak Time
1700
1700
1700
1700
1700
Ideal Cycle Time
1043
1043
1043
1043
1043
Average Fill
1045
1127
1460
1195
390
Operator Fill
1045
1127
1460
1195
390
USA
1450
1460
1460
1450
0
Europe
100
350
1460
600
1300

    This table contains as many columns as there are workstations (In this case 5).

    • Position : The position of the station in the line
    • Cycle Time : The cycle time assigned to this workstation by the user
    • Max Peak Time : The max peak time assigned to this workstation by the user
    • Ideal Cycle Time : The ideal cycle time of a workstation is the "Total Operation Time" divided by the "Total Cycle Time" (for all workstations and operations) multiplied by the current workstation cycle time
    • Average Fill : This value is the sum of the average duration of operations assigned to the workstation
    • Operator Fill : This value is the sum of the average duration of operations assigned to the workstation, taking into account the schedule of the operators within the workstation as follows: the Operator Fill is the work time of the slowest operator multiplied by the number of operators assigned to the workstation


        The following rows are present only if you choose the explicit mode of the variants. There will be as many rows as there are variants (In this case there are two of them : USA and Europe). Each value is the time taken by the variant in the particular workstation. For example the variant "Europe" will take 350 time units to execute on the station "Workstation 2".


  • Generate Workstation Details : This option will generate a table per workstation in the following format :

**************************************************************
* Name
Workstation 1
Position
1 of 5
* Cycle Time
1500
Max Peak Time
1700
* Ideal Cycle Time
1043
Average Fill
1045
Balance 100.15 percents
* Ideal Cycle Time
1043
Operator Fill
1045
Balance 100.15 percents
* Workstation type
Manual
* Number of operations
6
Operators
1
**************************************************************

Operation ID Code Name Time Average Time(For all required operators) Operators Operators List Start Time
1 V1-1 Take and place a White internal box on the table
300
210.0
1
0; 0
2 V1-2 Open the White internal box
200
140.0
1
0; 420
3 Code 2 Place the CD box on the table
300
210.0
1
0; 210
4 Code 3 Open the CD box
200
140.0
1
0; 560
5 Code 4 Insert the Folder into the CD box
450
315.0
1
0; 700
17 Code 16 Take and place a Brown internal box on the table
100
30.0
1
0; 1015


The first table displays details about the workstation :