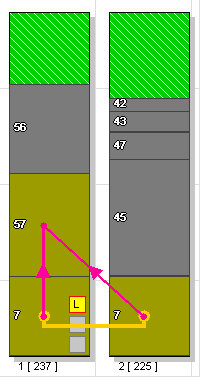
The Operators Tab graphical representation
|
|
The Operators Tab graphical representation |
 The Operators Tab Graphical Representation This representation shows, for the
selected workstation, as many task schedule bars as there are operators
assigned to the workstation. Each of the task schedule bars represents
the tasks performed by the associated operator, with the time going
from bottom up. Each task (operation) is represented by a segment.
An operation requiring multiple operators is represented by that many
time segments (one per operator) joined with a yellow line
(for instance the Operation 82 in the above graph). A precedence
constraint between operations within the workstation is represented
by a red arrow going from the predecessor to the successor (bottom
up). Below each operator task schedule bar is the id of the operator
and the total length of his schedule, i.e. the time unit when all his
tasks are finished.
|