| When you select a gene (e.g. by clicking in the
table in the main graph), the raw data
window is updated with the values of the selected gene. This gives you the
opportunity to check that ArrayMiner correctly interprets your data.
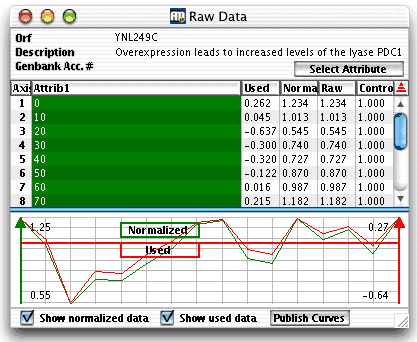
Raw Data Window
In cases where there are several
attributes identifying a column (e.g. there are two in the below figure),
one of them may be used to visually separate groups of columns in the
main window.by using the"Select
attribute" button. The column of the separating attribute
is colored green, as in the below figure, where the columns are separated
by stage (i.e., Embryonic, Prenatal, etc.).
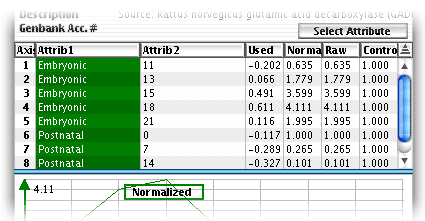
Raw Window Attributes
Table part
- Axis is the number of the column in the dataset. This typically
corresponds to one sample on which the expression levels were measured,
or one time point in a time series.
- One or more Attribute columns identify a column. This is typically
the identification of the sample or of the time point in a time series.
For instance, in the above figure the first data column is identified
by two attributes: stage "Embryonic" and day "11".
- Clustering
- Used are the values used by ArrayMiner in computations.
This takes into account the possible transformation of the expression
values due to the application of log, and/or the selected distance
measure (read more on these parameters here).
- Normalized are the expression values as they were received
in the dataset, either from a data
file, the clipboard,
or by data exchange with GeneSpring.
In the last case, the data in this column may be the result of a
column aggregation.
- Raw indicates the expected expression values before normalization
using control values.
- ClassMarking
- Used are the values used by ArrayMiner in computations. This
takes into account the possible transformation of the expression values
due to the application of log, and filter parameters
- Normalized are the expression values as they were received
in the dataset, either from a data
file, the clipboard,
or by data exchange with GeneSpring.
In the last case, the data in this column may be the result of a column
aggregation.
- For display This column displays the value used for drawing
in the classmarker windows. These values are the same as the "Used"
values divided by the gene standard deviation. These values are not
used to compute classes.
- Control shows the control values used to normalize the raw
values in order to obtain the Normalized ones. This column is most useful
when the data are obtained from GeneSpring, in that case the values
must match the Control values in GeneSpring. When no control values
are available in the data, the column contains the value 1 for all columns.
Graphical part
The graphical part displays the gene profile.
If you select the "Show normalized" checkbox,
the profile is drawn using the normalized data values. The normalized
profile will be green colored and its maximal and minimal values displayed
in the left part of the window. If you select the "Show used"
checkbox, the profile is drawn with the used data values. The used profile
will be red colored and its maximal and minimal values displayed in the
right part of the window. The "Publish" button
lets you save the graphical part of the window as a bitmap.
|