|
|
The Main Window List Panel |
 List Panel |
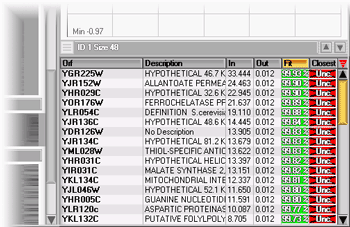
The List Panel shows the list
of genes in the currently selected cluster (click on the heat
map of a cluster to select it). The list is scrollable with the scroll
bar on the right of the list, or with the mouse wheel (the wheel must
be positioned on the list). The list shows useful information on the genes
in the cluster, including their names, descriptions, distance to the center
of the cluster ("In"), distance to the center of the closest
other cluster ("Out"), a measure of fit of the gene within the
cluster ("Fit", computed with the formula (Out-In)/(Out+In)),
and the other cluster that is closest to the gene ("Closest")
identified by its color code and ID. |
Double-clicking in the table will pop up the raw data window of the selected gene. Table contextual menu A right-click on a line in the
gene list brings up a popup menu that allows you to isolate
the gene in the 3D view: the representation mode is switched to 3D,
and only two clusters are shown, the gene's own and the second closest
to it (the "second choice" for the gene). This allows for an
extremely convenient way of assessing why a gene was put into a cluster,
rather than any other. The popup also lets you show the cluster in the
Closest Clusters window and to
copy the list into the clipboard. |