|
|
The Main Window Profiles Panel |
 Profiles Panel |
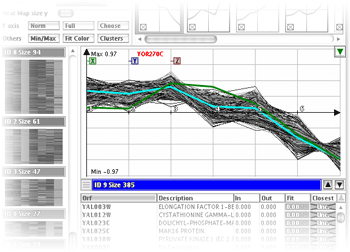
The panel shows the profiles
as lines with vertical positions dependent on the level of expression.
It also identifies the axes used in the 2D
and 3D views (the X,Y,Z boxes). |
A right-click on the heat map
of a cluster allows you to select the clicked gene, it is then marked
in the heat map as well as in the 2D or 3D views. You can also show that
cluster in the Closest Clusters window,
where it can be then compared to the other clusters. Finally, you can
put the list of the genes in the clicked cluster into the clipboard, allowing
you to paste the data into another application, such as Microsoft Excel. |