|
|
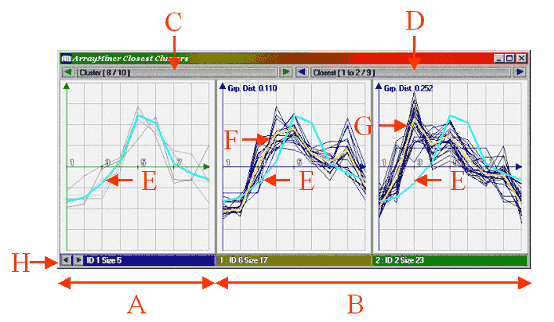
The Closest Clusters Window |
|
When you right-click on a cluster in the main graph, you can show the cluster in the Closest Clusters window. It will appear on the left side of the window (Part A in the following figure). The clusters on the right (Part B) are the ones closest to the cluster in Part A, sorted by distance between average profiles. In the example in the following figure,
the selected cluster is the cluster with ID 1. Its nearest neighbor (the
cluster with average profile most similar to that of ID1) is the cluster
of ID 6, the second-nearest is the cluster of ID 2. You can change the
selected cluster by directly clicking on the C control. You can also scan
all the closest neighbors by using the D control.
The selected cluster is displayed
using gray profiles (Part A), while its average is drawn with a thick
light cyan line (E). The profiles in the closest clusters are displayed
in blue with their average colored in yellow (F and G). For facility of
comparison, the average of the selected cluster is displayed in light
cyan on all graphs (E), which shows in a very clear way the differences
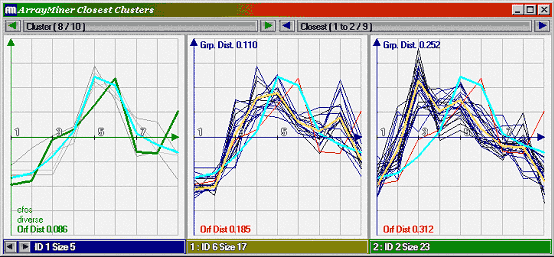
between the selected cluster and the other clusters. You can click on a profile to compare its distance to each group, as illustrated in the following figure.
The selected profile is displayed
in green in its own cluster, and is displayed in red in the other graphs.
The distance between the selected profile and the average of the cluster
is displayed in green or red depending on the fact that the profile is
or is not in the cluster. |