| 
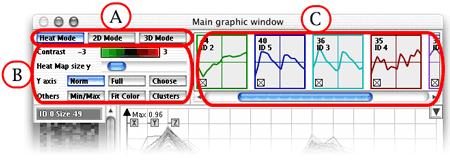
- To learn more on the A part click here
- To learn more on the B part click here
- To learn more on the C part click here
The A Part
The B Part
- The color rule gives you the link between a color and a level of activity
used in the Heat Mode Panel. You can click on the color rule to change
the scale, or turn the mouse wheel when the mouse pointer is on the
scale, to lighten or darken the colors.
- The heat map size y allows you to change the height of the heat
map panel.
- The "Norm", "Full" and "Choose"
buttons let you control the vertical scale used in the Profile Panel.
- The "Min/Max" button switches between showing in
the Profile Panel the profiles of all genes in the selected cluster
("Min/Max" unselected), or the envelope (maxima and
minima) of the genes in the cluster ("Min/Max" selected).
- The "Fit color" button shows the profiles in the
Profile Panel in colors that depend on the value of the fit of the gene
within its cluster.
- The "Clusters" button governs what is shown in the
Profile Panel. When not selected (as in the figure above), the Profile
Panel shows the profiles of the genes in the selected cluster. When
"Clusters" is selected, the Profile Panel
shows the average profile of all clusters, a view useful for assessing
the differences between clusters.
|