The Profiles Header


    Whatever the selected display mode (Heat Map, 2D or 3D), the Main Window shows at the top a list of "thumbnails" of all the clusters in the current solution, providing a convenient overview of the clusters and a way of navigating among them:


The Profiles Header


    Each thumbnail shows the average profile of the cluster, and the size (number of member genes) and identifier of the cluster it refers to. In the bottom left corner of the thumbnail is a selection checkbox: when the checkbox is checked, the corresponding cluster is shown in the 2D and 3D views. When it is unchecked, the cluster is hidden in those views (in the Heat Map, hidden clusters are shown in grayscale).
    The currently selected cluster is identified by a thick selection border (cluster of 49 genes with ID 0, in the above figure).

    The Profiles Header provides for an easy way of showing just the clusters of interest, and showing them uncluttered by the other clusters in the 2D or 3D view. The easiest way of achieving this is to

  • make sure that all clusters are selected for display, by possibly hitting the 'A' key
  • hide (uncheck) the clusters of interest by clearing their thumbnail checkboxes. The average profiles provide a guidance for identification of the target clusters. This will hide the clusters of interest
  • hit the 'I' key. This inverts the list of selected/hidden clusters, so that only the clusters of interest are now shown in 2D/3D.

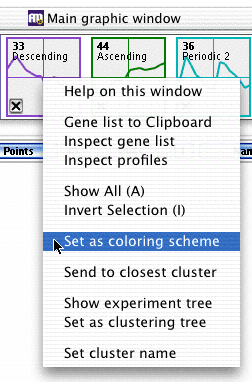
    Right clicking on a profile will pop up additional options :

  • Gene List to clipboard : This option will copy the genes present in the cluster in the format specified by the gene list to clipboard preference window.
  • Inspect Gene List : This option will pop up a window containing all the genes present in the cluster
  • Inspect profiles : This option will pop up a window showing all the profiles present in the cluster

  • Show All : Same as above
  • Invert Selection : Same as above

  • Set as coloring scheme : This option will generate a coloring scheme and add it to the Color Scheme panel with the currently displayed solution
  • Send to closest cluster : This option will display the selected cluster in the Closest Cluster window. You can also double click on a profile to perform the same action

  • Show experiment tree : This option will create an experiment tree with all the genes present in the cluster
  • Set as clustering tree : This option will create a clustering tree with all the cluster averages.

  • Set cluster name : This option will rename the currently selected cluster