Using the experiment tree window

Experiment Trees

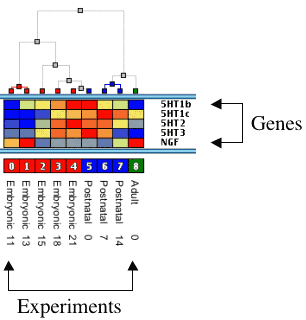
    Experiment trees are a convenient way to view how your experiments match together. The tree is built with the following rules :

  • Find the two nearest experiments not already merged
  • Replace them by their average
  • Repeat the first step until there is only one node left

    Each node is colorized by the attribute of the experiment until the node is merged with a node with another attribute. The distance of each node to its two leaves is proportional to their distance. Clicking and maintaining the mouse down on a node display the distance between the two leaves.


Experiment tree window header

Left buttons

  • The "Get All Data" button will compute the experiment tree depending on your project status :
    • If your are using the clustering module, it will build an experiment tree with the whole dataset, you can build an experiment tree from a particular cluster by right clicking on it in the main window header
    • If you are using the classmarking module, the tree will be based on the genes present in the currently selected tab
  • The "Save Tree" button will save the tree as an AMT file
  • The "Load Tree" button will load a tree stored in an AMT file. Note that you can download a tree from within an AMG or AMP file if they include one
  • The "Fish Eye" button will display the current tree in the fish eye view

Preferences control

  • The "Heat X" slider changes each heat map rectangle width
  • The "Heat Y" slider changes each heat map rectangle height
  • The "Tree H." slider edits the height of the whole tree in the window
  • The "Show grid" button draws a border to each heat map rectangle
  • The "Class Names" checkbox hides/shows the class of each experiment in the bottom part of the window
  • The "Height" slider edits the height available to draw the experiment class of each experiment
  • The "Experiments" checkbox hides/shows the experiment name of each experiment in the bottom part of the window
  • The "Height" slider edits the height available to draw the experiment name of each experiment
  • The "Gene Names" checkbox hides/shows the name of each gene in the heat map part of the window
  • The "Width" slider edits the width available to draw the gene name of each gene in the heat map part of the window
  • The "Gene Descriptions" checkbox hides/shows the description of each gene in the heat map part of the window
  • The "Width" slider edits the width available to draw the gene name of each gene in the heat map part of the window