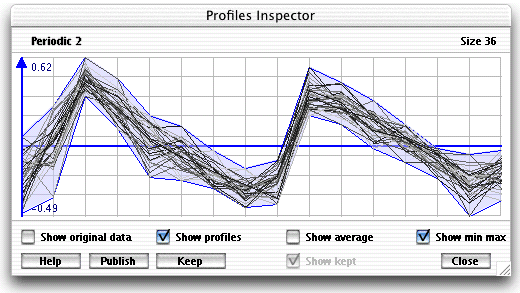
The profile inspector window lets you view the
profiles in a cluster. You can display it by right clicking in the main
graph header or right clicking in the similarity
tab of the search window.
- The "Show original data" checkbox displays
the profiles without normalization (original data)
- The "Show profiles" checkbox shows/hides
the profiles
- The "Show average" checkbox shows/hide
the average of all the profiles
- The "Show min max" checkbox shows/hide
the min max region of all the profiles (blue part in the above figure)
- The "Publish" button saves the current
figure as a bitmap
- The "Keep" button saves the average and
the min max region of all the profiles present in the window
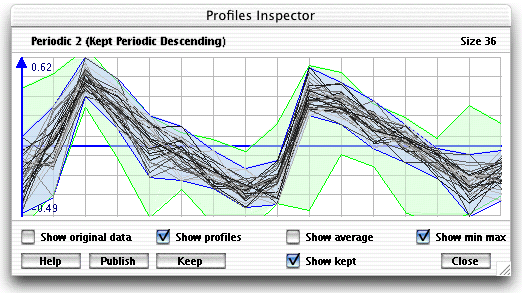
- The "Show kept" checkbox shows/hides the
previously saved min max region. The saved region will be colored green
as shown in the above figure. Its mean (if the "Show average"
checkbox is checked) will be colored green as well.
|

