Saving Clusters in HTML for the Web
   
    This option of the save solution dialog box allows you to generate a whole website describing your current classification. To save the generated files, click on the "Save" button and specify the output folder.

     The output folder will include multiple files :

  • An index.html file which is the cluster selector page
  • Multiple Cluster*.html files which are the cluster content pages
  • An Image folder including the necessary images and help pages
 
Parameters
  • Include Pictures : This option will add to each cluster content page a picture of the cluster profiles. You can define the quality of the JPEG output using the quality checkboxes. You can also modify the size of the resulting pictures by defining new size constraints
  • Include Index Pictures : This option will add to the index page small figures depicting each cluster average profile
  • Include Current 3D View : This option allows you to add an interactive java 3D figure of your clustering into your website. Note that when checked, this option will pop up a new parameter window when the site is created.(Learn more on 3D parameters here)
  • Include Project Notes : This option will add a page to your website containing the text of your project notes window
   

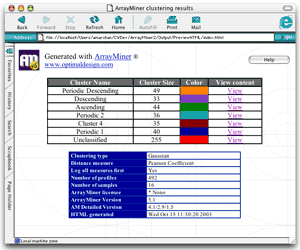
Cluster Selector HTML file (index.html)

    This html file contains two tables. The first one lets you view the content of the clusters present in the classification and the second one details about the classification parameters.

The cluster table

Cluster Name
Cluster Size
Color
View content
My cluster name
327
View
Cluster 1
291
View
Unclassified
176
View

    Each line of the table describes a cluster. The view content column gives you access to each cluster content.

The information table

 Clustering type  Gaussian
 Distance measure  Pearson Coefficient
 Log all measures first  No
 Number of profiles  1446
 Number of measures  7
 ArrayMiner licensee  Owner
 ArrayMiner Version  5.1
 AM Detailed version  4.1/2.9/1.5
 HTML generated  Tue Oct 14 12:42:31 2003

    This table displays details on the classification :

  • Clustering type : This field describes the global model used by ArrayMiner for the clustering
  • Distance measure : This field describes the distance measure used for classification (Euclidean, Correlation, Pearson)
  • Log all measures first : Whether or not a logarithm transformation was applied to each expression value before clustering
  • Number of profiles : The number of profiles present in the classification
  • Number of measures : The number of samples present in the classification
  • ArrayMiner licensee : The owner of the licence who generated this output
  • ArrayMiner version : The global version number of the ArrayMiner software which generated the files
  • ArrayMiner detailed version : The detailed version number of the ArrayMiner software which generated the files
  • Html generated : The date when the output was created

Cluster Content Page

    You can access these pages by clicking on a "View" link in the cluster selector page which is accessible via the "Back to index" button. The header on the top of the page displays the cluster name and size. The table is filled with all the members of the cluster as shown in the following sample.

ID
Description
In
Out
Fit
Closest
YCR034w GNS1 PROTEIN. 18.8 0.0095 99.90 %
Unclassified
YBL077W INTERGENIC REGION. 14.2 0.0095 99.87 %
Unclassified
YOR051C S.cerevisiae chromosome 13 0.0095 99.85 %
Unclassified
YGL012W STEROL REDUCTASE 11.1 0.0095 99.83 %
Unclassified
YBR162C REGION PRECURSOR. 15.4 0.0165 99.79 %
Cluster 3
  • ID : The Gene identifier
  • Description : The Gene description field if any
  • In, Out and Fit : These values depend on the clutering model selected for the classification (Classic or gaussian). If the selected model is classic, the In column displays the distance of the gene to its cluster center, the Out the distance from the gene to its closest cluster. The Fit column is computed as follows : (Out-In)/(In+Out). If the selected model is gaussian, the In column displays the probability density of the gene to belong to its cluster, and the Out value the probability density to belong to its closest cluster. The Fit column is computed as follows : (In-Out)/(In+Out)
  • Closest : This column displays for each gene the name of the closest cluster other than its own. In other words, this column shows the "second choice" for each gene

Note     The resulting html files can be directly open in most popular spreadsheet software, such as Microsoft Excel®.