|
|
Tutorial 1 : A first simple project |
1 : Introduction In this tutorial you will learn how to:
2 : Management of the projects Once Optiline is launched, you discover a window
entitled: “Editing Project: New Project” (Figure 2-1). The
main window is divided in three tabs. The first tab "Operations"
lets you define your product, the second one "Workstation" your
line, and the third one displays the detailed schedule of all operators.
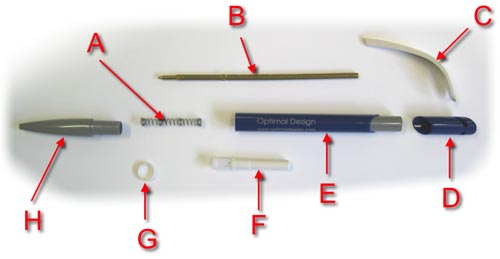
Use the Save As option from the file menu to save your project. Set the file name to MyFirstProject.tsv. 3 : Defining the product The product we will study is the pen depicted in the following picture.
Figure 3-1
The following table describes all operations required by the assembly and their durations.
Operations Table 4 : Create the precedence graph The first step to accomplish when you start the study of a new product with Optiline is to build its precedence graph. This graph will contain the following information:
In order to explain a precedence graph creation,
we will create the graph corresponding to the pen described in the previous
section. We have 9 operations to define for this product. Click first
on the “Operations” tab if you are not yet
in the “Operations” environment. A blue rectangle as illustrated in the following picture will appear with the operation name written inside. On the bottom part of the window, there are several fields allowing you to modify the information attached to this operation.
If you click anywhere outside the rectangle
in the drawing zone, you will unselect the operation and these fields
will be disabled. If you now click on the rectangle (the operation) “Name
1”, these fields will become editable again.
As the operation "Insert the white internal cylinder into the central cover" in the operation table defined above has to be executed after our first operation, a precedence constraint between the two operations has to be defined. To add the second operation, select the first
one by clicking on it and then use the "Add One Successive Operation"
button.( Your precedence graph should now looks like the following picture.
The arrow joining the two operations means that the first one must be carried out before the second one. Like for the first operation, you must change the second operation properties by using the bottom of the window fields. Set the name to "Insert the white internal cylinder into the central cover" and the time to 400 and then click on the "Apply" button.
5 : Adding precedence constraints between operations Clicking on each operation lets you edit and inspect its properties.We will now add precedence constraints between all these operations. First we will create a Precedence constraint between the "Insert the white..." operation and the "Place the spring..." operation. For this purpose, we will right-click on the "Insert the white..." operation as depicted in the following figure.
Select the "Add Successor" option. A yellow arrow will appear, move it to the "Place the spring..." operation and click the mouse button as shown in the following picture.
Repeat the same steps to add a precedence between the "Insert the white..." operation and "Insert the main..." operation, to get the situation depicted in the following picture.
To add multiple precedences in a row, you can select multiple operations as depicted in the following left picture, right-click on one of the selected operation and choose the "Add Successors" option. Two yellow arrows will appear as shown in the following right picture. Move your mouse to the "Place the central..." operation and click on it to finish the precedences.
Add the required arrows to match the following figure.
6 : Create a first layout of the line We are now ready to create a first layout of our line, by using the “Workstation” environment. For this, you have to click on the “Workstation” tab. The “Workstation” environment is divided into three parts:
To create a workstation simply click on the add
one workstation button in the middle right part of the window.( A new workstation will appear as a vertical green bar in the top right part of the window as shown in the following picture. Like for the operation, just click on the workstation (in the top right area of the window) to edit its properties in the bottom of the window fields.
Select the workstation and set the Cycle Time to 1800 and its Max Peak Time to 2000. Click on the "Apply Button". Create 2 additional stations with
the the add one workstation button in the middle right part of the
window.( Select now the first operation in the list by
clicking on it. Click then on the first workstation to select it (it will
be highlighted), and click on the button "Assign operation
to a workstation" button. ( This will have as effect to add the selected operation to the workstation 1 as shown in the following picture. The first column of that operation is now green, meaning that it has been placed into a workstation. You will thus have a first complete layout when the whole list is green.
It is also important to note that when you select an operation in the list, one or several green arrows are painted above some workstations. Only the workstation having that green arrow on their top can accept the selected operation (This means that putting the operation on the workstation does not violate precedence constraints,types,links,e.t.c.).
7 : Interactive Balancing
8 : Automatic Balancing
9 : What's next ?
|