|
|
What is a BOM ? |
|
The Bill Of Materials (BOM) constitutes one of two ways of representing variants in OptiLine, the other being the explicit variants representation. The BOM is represented and edited by means of the BOM graph described below, accessible in the BOM dialog. |
|
|
OptiLine's BOM is related to the more traditional Bill Of Materials in the following way. Since the BOM graph gives the percentage of each variant in the average production, and each operation is linked to a BOM node (or appears in 100% of the products), you only need to multiply the percentage of occurrence of each operation (as given by OptiLine's BOM) by the number of products to be assembled, to obtain the number of times each operation will be performed in the production (assuming that the production will comply with the average product mix defined by OptiLine's BOM). Supposing further that each operation represents mounting one or more parts to the product being assembled, the number of parts necessary for the production is thus directly available. In the BOM representation of variants, variants are not explicitly listed. Rather, they are implicitly defined by the percentage of each variant operation in the total production, which is why it is termed implicit variants. The percentage supplies the necessary information on the relative frequency of each operation in the total product mix being assembled on the line, hence enabling the automatic balancing of the line with average operation durations. On the other hand, in comparison to the explicit variants, it lacks the additional information on how the operations are combined in each product variant. By virtue of not explicitly listing all possible variants, the BOM has the advantage of being extremely compact: it has the power of representing thousands of variants with very few explicit data. For instance, consider the situation where 16 options (e.g. sunroof, CD player, seat heating, leather upholstery, etc. on a car) are being offered on the product, each independently of the others. Since each option is present or absent, there are two variants per option. The number of possible variants is therefore 2 to the power of 16, i.e. 65536 possible variants of the product. Explicitly listing all of them is clearly unworkable. In the BOM representation of
variants, the user builds a graph of the structure of the product that
represents all the options and their possible relations. In the BOM,
any number of options may be independent of each other, or be related
by restriction, logical OR, logical AND, or logical NOT (complement). |
|
The basic BOM relation is variant separation. It expresses the fact that certain operations are performed on only a subset of the total product mix. The following is the BOM graph representing a variant separation: |
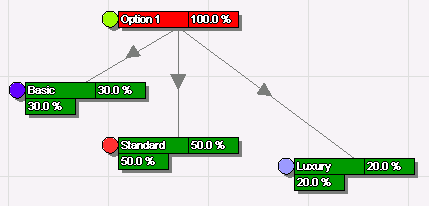
Variant separation
|
The figure expresses the fact that there are three possibilities for Option 1: Basic, Standard and Luxury. Furthermore, in the total product mix, there are 30% of Basic, 50% of Standard and 20% of Luxury version of Option 1. The red rectangle is called
a root node of the BOM graph. The green rectangles are called
leaf nodes. A variant separation is simply expressed by several
leaves stemming from a root node. Each of the leaf nodes has a percentage
of occurrence of that variant within its root. The percentage
in the total production of the variant corresponding to a leaf node
is computed by multiplying the root's percentage by the leaf's. While the user specifies the percentage of each leaf within its root, the percentage of the root need not be 100% of the total production, as the root itself may represent a subset of the production mix. The BOM editor automatically computes the final percentage of each of the leaves, by multiplying the percentage of the root by the user-defined percentage of each leaf within the root. The final percentage appears on the right of the name of the leaf, while the percentage of the leaf within the root appears below the name. |
|
The BOM graph allows to express the fact that some options are available (and the corresponding assembly operations are performed) on several different models. This is done by pointing several leaf nodes to a root node. The root is then the logical OR of the leaves, as in the following figure: |
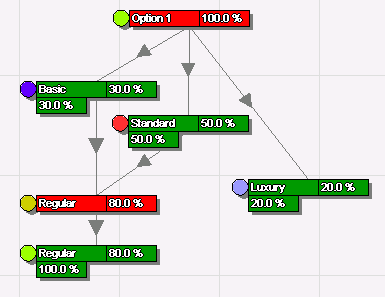
Logical OR
|
The figure expresses the fact that products with Option 1 Basic OR Option 1 Standard, are Regular. The BOM editor automatically computes the percentage of the Regular version of the product in the total production: it is the sum of percentages in the total production of Basic Option 1 and the Standard Option 1, that is, 30% + 50% = 80%. |
|
The BOM graph also allows to express the fact that some options are available (and the corresponding assembly operations are performed) only on models that have several options present simultaneously. This is done by pointing several root nodes to another root node, and amounts to a logical AND, as in the following figure: |
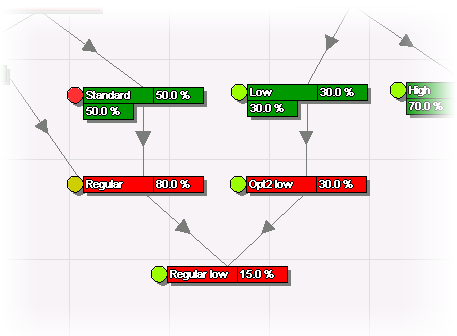
Logical AND
|
The figure expresses the
fact that the option "Regular low" is only available on
models that are Regular and have "Opt2 low". Establishing
the percentage of "Regular low" in the total production
is more difficult, because the implicit variant model does not contain
the information on how many of the "Regular" products actually
are "Opt2 low" as well. In this case, the BOM editor computes
an estimation of the percentage, based on the assumption that
options are distributed in a uniform way over all products. Under
that assumption, since there are 30% of "Opt2 low" in the
total production, there are 30% of the Regular products that are "Opt2
low" as well, yielding 30% of 80% of the products, i.e. 24% of
the total production. |
|
Finally, the BOM editor allows to very simply express the complement of a percentage in the total production, i.e. the fact that an option is present (and the corresponding assembly operations are performed) whenever a (set of) option(s) in not present. This amounts to a logical NOT. A complement is expressed by attaching an inverse node, represented by a bright green rectangle, to a root node. The percentage in total production of an inverse node is equal to 100% minus the (sum of) percentage(s) of any leaf node(s) attached to the same root. |