The Main Window 2D/3D Density Graphs
|
|
The Main Window 2D/3D Density Graphs |
|
|
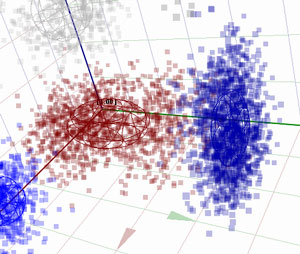
Density Graphs are displayed by selecting the Dn, Dl, or Dv mode of display of points representing the genes in the 2D button panel or 3D button panel, respectively. The three modes differ by the emphasis they put on high density areas in the image: the Dl (Density Light) and Dv (Density Very Light) modes reduce the influence of high-density areas, which is useful on large data sets where high-density areas are abundant. The position of the 3D Density Graph is adjusted as with other 3D graphs (see here). |