|
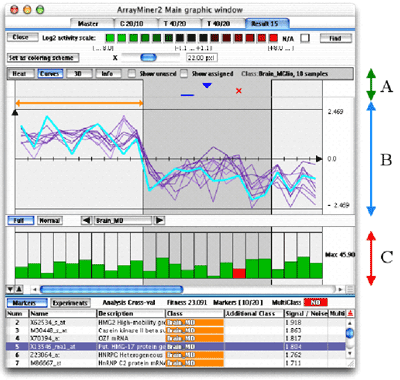
The Curves Part of the Curves Mode window (B Part)
You can select a particular gene by clicking
on it. The selected gene will be colored cyan. The two buttons on the
bottom of the graph let you select how the curves are displayed. The Full
mode will expand the curves to the full height of the B Part.
You can change the displayed class by selecting
it with the buttons on the right of the Full and Normal
buttons (these buttons are located between the B and the C part of
the previous figure).

Curves mode and multiclass
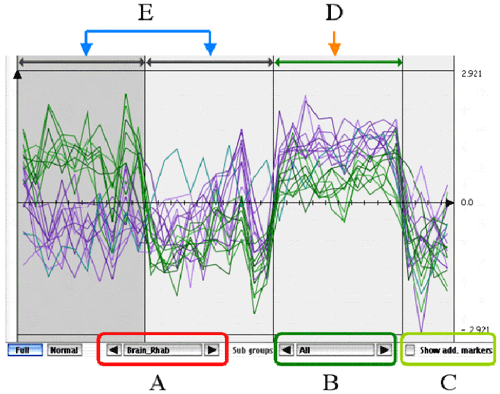
If you use the multi-class mode of ClassMarker,
there could be more buttons (B and C in the above figure). As
in non muticlass marking, the A button lets you choose the discriminated
class. In the above figure, the selected class is named Brain_Rhab
and is shown by the D arrow. There are two additional classes used
for discriminating, shown by the two E arrows. The color of genes
corresponds to the gene's subgroup : the selected class alone, or the
selected class plus one other. In the above figure, they are all drawn
because the B selector is in the All position.

Multi-Class Curves Mode Main Group
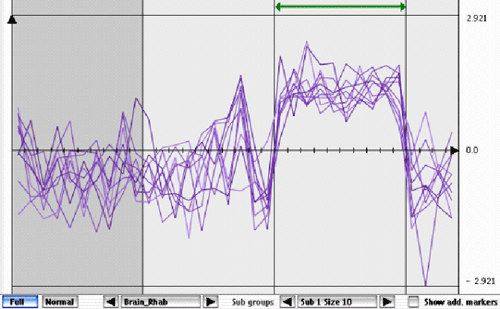
If you use the B selector, you will be
able to select one subgroup of the selected class.

Multi-Class Curves Mode Secondary Groups
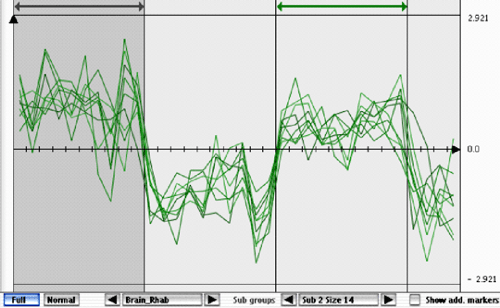
In the previous figure, a secondary
group is shown. It discriminates the selected class (green arrow)
and an another class (gray arrow) against all the other classes.
If you now check the Show Add. Markers, the genes that discriminates
only the selected class (green arrow) and the other class (gray
arrow) will also be drawn (they will be drawn in gray).
These genes are used to find to which class of the subgroup belongs one
particular sample. If we don’t use them, we could not determine
if a sample belongs to the gray or the green arrow class.
The Histogram Part of the
Curves Mode (C Part)
This histogram shows for each
class the quality of the prediction. If the bar is green, the prediction
was successful, a red bar means the prediction failed (the sample
was re-classified into a class other than the sample's). If a red
bar (failed sample) has a high score (higher than some of
the green bars), it is probably misclassified.
|
