|
|
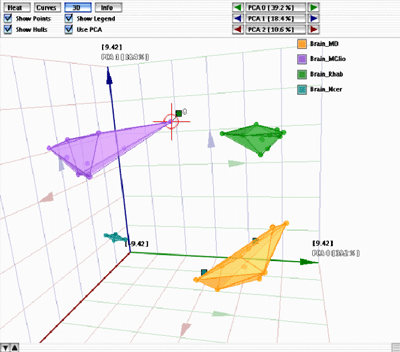
The ClassMarker Result Tab 3D Mode |
|
You access this mode by clicking the “3D” button in a Result Tab. Unlike the clustering
tool of ArrayMiner, this view does not show the genes in the experiment
space, but rather the samples (experiments) in the marker genes space. |
 A result pane in 3D mode |
Each class has a unique color. You can use the various checkboxes to customize the rendering. To select a particular sample switch the table in the bottom of the window to "Experiments", and click the appropriate line. If a sample is misclassified, as shown in the figure on the left, a small colored panel is attached to it, showing the color of the class it has been assigned to (in the figure on the left, the targeted sample should belong to the purple class, but has been assigned to the green class instead). The 3D cube and all the data displayed inside can be easily rotated in real time into any viewing angle by simply clicking the mouse inside the cube and dragging it in the desired direction. The view can be zoomed in or out with the mouse wheel. |
|
|